
Filling-Line Output: Rated Speed, Good Bottles and Shift Time
Convert bottles per minute to bottles per hour, separate planned production time from stop, speed and reject losses, and calculate shift good-bottle output.
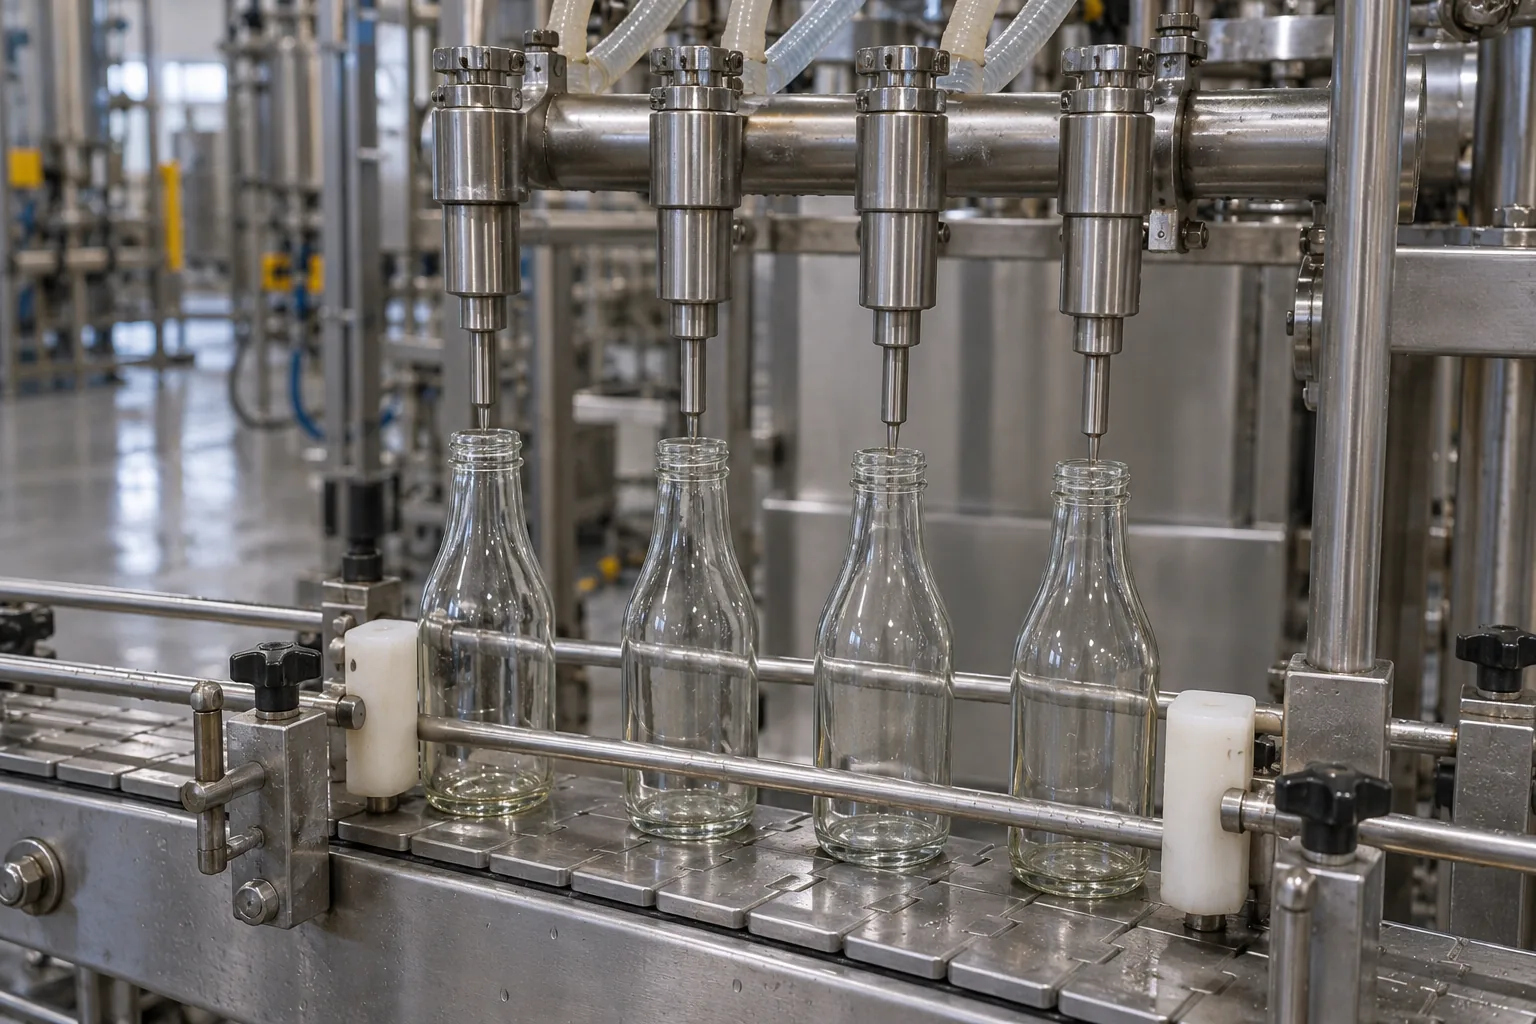
Multiplying a catalog bottle-per-minute figure by sixty and then by shift hours overstates usable output because it ignores downtime, slow cycles and rejected bottles. Convert rated speed into shift good bottles only after fixing the bottle, closure, liquid and pacing station, then apply either explicit Availability, Performance and Quality factors or a single Overall Equipment Effectiveness (OEE) factor on Planned Production Time so losses are never deducted twice.
A glass-bottle filling line has no single universal speed: published filler and line figures depend on whether container handling is operator-paced or automatic, the bottle volume and neck finish, the liquid’s viscosity and foaming behavior, and which linked station paces the line. Liquid Packaging Solutions (LPS) illustrates that an automatic indexing filler’s rate in bottles per minute (BPM) equals fill heads multiplied by cycles per minute—such as 4 heads running 6 cycles per minute on 16 oz bottles for 24 BPM (1,440 bottles per hour), or 8 heads running a 15-second total cycle (4 cycles per minute) for 32 BPM (1,920 bottles per hour) (both accessed October 17, 2026). To translate a stated BPM or bottles per hour (BPH) figure into shift good bottles, use the conversion table, Vorne OEE definitions and worksheet below.
Swipe or scroll horizontally to see all columns.
| Input or term | Formula or published basis | Why it matters when comparing proposals |
|---|---|---|
| Instantaneous unit conversion | BPH = 60 × BPM; BPM = BPH ÷ 60 |
Put every station proposal into the same rate unit before comparing capacities |
| Ideal Cycle Time | 60 ÷ Ideal Run Rate (BPM) in seconds per bottle (Vorne OEE.com, accessed October 17, 2026) |
Links instantaneous conveyor spacing and machine speed to OEE Performance |
| Automatic indexing filler rate | BPM = Fill Heads × Cycles per Minute, where cycle time includes indexing, head dive and fill duration (LPS, accessed October 17, 2026) |
Adding nozzles only raises BPM in proportion if total cycle duration and product supply stay constant |
| Pacing station rate | The slowest linked station sets maximum line BPM (LPS, accessed October 17, 2026) | A faster filler cannot exceed a slower capper, labeler or case packer without accumulation or parallel capacity |
| Planned Production Time | Shift Length − Schedule Loss (breaks, meal periods, no-order periods; Vorne OEE.com) |
Defines the time denominator for Availability and OEE |
Run Time and Availability (A) |
Run Time = Planned Production Time − Stop Time; A = Run Time ÷ Planned Production Time (Vorne OEE.com) |
Separates changeovers, cleaning and breakdowns from running speed losses |
Performance (P) and Quality (Q) |
P = (Total Count ÷ Run Time) ÷ Ideal Run Rate; Q = Good Count ÷ Total Count (Vorne OEE.com) |
Separates minor jams and derated speed (P) from startup and inspection rejects (Q) |
| Shift Good Bottles | Path A: Run Time × Ideal Run Rate × P × Q; Path B: Planned Production Time × Ideal Run Rate × OEE |
Using both a reduced Run Time and an aggregate shift OEE deducts stop time twice |
Jump to the BPM-to-BPH conversion table, review the non-duplication rules for OEE losses, check the worked shift examples, or download the blank CSV worksheet.
Why “how fast is a filling line” has no single speed
In published guidance on bottle speed and container size, Liquid Packaging Solutions (LPS) states that the question of how fast a filling machine runs cannot be answered without three project-specific inputs: the level of automation, the product characteristics, and the bottle size (accessed October 17, 2026). On a full glass bottling line, a fourth boundary applies: the slowest linked station governs overall throughput.
- Automation level and operator pacing. On a semi-automatic filler, an operator places containers under the nozzles, triggers the cycle and removes filled bottles; LPS notes that actual speed depends on operator pace and cannot be predicted as a fixed machine constant. Automatic fillers use a power conveyor and indexing or rotary transfer so cycle timing does not wait on manual placement. For manual, semi-automatic and compact setups, see small-scale bottling equipment.
- Product viscosity and foaming. Free-flowing liquids such as water fill faster than viscous sauces, syrups or oils, and foaming or carbonated liquids require controlled valve entry, bottom-up filling or counter-pressure stages that lengthen the fill portion of the cycle. The glass bottle filling machines guide covers how filling principles match liquid behavior.
- Bottle volume and neck finish. LPS illustrates that a four-head filler fills four 16 oz bottles much faster than four 1-gallon containers because one gallon holds eight times the liquid volume of 16 oz. Neck bore diameter also limits nozzle outer diameter, which caps instantaneous flow velocity into the glass container.
- Cycle composition on automatic indexing fillers. In its guide to figuring out BPM needs, LPS explains that a fill cycle includes more than liquid flow time: container indexing time, nozzle dive/retract time and actual fill time all add together. In LPS’s published illustration of an eight-head inline filler where bottle indexing takes 6 seconds, nozzle dive takes 3 seconds and liquid dispensing takes 6 seconds, total cycle duration is 15 seconds (
60 ÷ 15 = 4 cycles per minute), giving8 heads × 4 cycles/min = 32 BPM(1,920 BPH). - The pacing station on a linked line. In The Overall Speed of a Packaging Line, LPS gives an example where a 16-head filler capable of 80 to 100 BPM and a spindle capper running near 100 BPM are linked to a labeler that processes 60 BPM on the chosen container and label; the overall line speed drops to 60 BPM. Station order and buffer placement around the pacing machine are covered in planning a glass bottling line.
Search results for “how fast is a filling line” also surface speeds from unrelated packaging sectors—such as sterile pharmaceutical vial lines running small 2 ml to 500 ml vials, industrial 5-gallon pail lines, or flexible tube fillers—as well as dental cavity articles. Do not extrapolate vial, pail or pouch figures to commercial glass beverage or food bottles: glass mass, rigid container spacing, neck finish tolerances and line-pressure limits are specific to the glass container drawing.
Takeaway: Treat any BPM or BPH number without a named bottle drawing, fill volume, product temperature/viscosity and station scope as an incomplete input, not a comparable proposal figure.
Unit conversion: bottles per minute (BPM), bottles per hour (BPH) and cycle time
Component suppliers often state speeds in different time units: inline fillers and cappers are commonly listed in bottles per minute (BPM), rotary fillers and depalletizers in bottles per hour (BPH), and case packers in cases per minute. Convert every station to a common unit before checking line balance or shift output:
- BPM to BPH:
BPH = 60 × BPM - BPH to BPM:
BPM = BPH ÷ 60 - Ideal Cycle Time (seconds per bottle):
Ideal Cycle Time (s) = 60 ÷ Ideal Run Rate (BPM) = 3,600 ÷ Ideal Run Rate (BPH) - Cases per hour (at instantaneous rate):
Cases/hr = BPH ÷ Bottles per case
The table below converts reference rates using exact arithmetic (BPH = 60 × BPM). These rows are mathematical unit conversions—including the 24 BPM and 32 BPM illustrative figures from LPS and the 60 BPM (1.0 s cycle time) reference from Vorne—not a cross-vendor speed benchmark or a promise of actual output.
Swipe or scroll horizontally to see all columns.
| Instantaneous rate (BPM) | Equivalent hourly rate (BPH) | Ideal cycle time (s / bottle) | 6-bottle cases / hr (at 100% rate) | 12-bottle cases / hr (at 100% rate) | Basis of row |
|---|---|---|---|---|---|
| 20 BPM | 1,200 BPH | 3.00 s | 200 cases/hr | 100 cases/hr | Exact unit conversion |
| 24 BPM | 1,440 BPH | 2.50 s | 240 cases/hr | 120 cases/hr | LPS 4-head × 6 cycles/min illustration (16 oz bottles) |
| 32 BPM | 1,920 BPH | 1.875 s | 320 cases/hr | 160 cases/hr | LPS 8-head × 4 cycles/min illustration (15 s cycle) |
| 40 BPM | 2,400 BPH | 1.50 s | 400 cases/hr | 200 cases/hr | Exact unit conversion |
| 60 BPM | 3,600 BPH | 1.00 s | 600 cases/hr | 300 cases/hr | Vorne 1.0 s ideal cycle time / LPS labeler-limited line illustration |
| 100 BPM | 6,000 BPH | 0.60 s | 1,000 cases/hr | 500 cases/hr | Exact unit conversion |
| 150 BPM | 9,000 BPH | 0.40 s | 1,500 cases/hr | 750 cases/hr | Exact unit conversion |
| 300 BPM | 18,000 BPH | 0.20 s | 3,000 cases/hr | 1,500 cases/hr | Exact unit conversion |
Unit conversion changes only the time scale of the rate (minutes to hours). A machine running at an instantaneous rate of 60 BPM cycles at 1.00 second per bottle, which equals 3,600 BPH while running at top speed; how many accepted bottles reach the pallet in an actual shift depends on how many minutes the line runs, how close it stays to 60 BPM while running, and how many bottles pass inspection.
Shift time and OEE definitions: how to avoid double-counting losses
To convert an instantaneous rate (Ideal Run Rate) into shift good-bottle output without counting the same loss twice, keep time buckets and efficiency factors aligned with the standard Overall Equipment Effectiveness (OEE) definitions published by Vorne Industries (oee.com, accessed October 17, 2026).
1. Time buckets and the three OEE factors
Vorne divides shift clock time and production losses into three sequential stages:
Swipe or scroll horizontally to see all columns.
| OEE stage | Formula (Vorne OEE.com) | Six Big Losses category included | Bottling-line examples to assign here |
|---|---|---|---|
| Planned Production Time | Shift Length − Schedule Loss |
Schedule Loss (excluded before OEE begins) | Scheduled unpaid or unstaffed breaks, meal periods, or hours with no scheduled orders |
Availability (A) |
Run Time ÷ Planned Production Time, where Run Time = Planned Production Time − Stop Time |
1. Equipment Failure (unplanned stops) 2. Setup and Adjustments (planned stops) |
Bottle/closure format changeovers, CIP/sanitation during scheduled shift time, label or foil roll changes, breakdowns, upstream bottle starvation, downstream case-packer blocking |
Performance (P) |
(Ideal Cycle Time × Total Count) ÷ Run Time, or (Total Count ÷ Run Time) ÷ Ideal Run Rate |
3. Idling and Minor Stops (small stops) 4. Reduced Speed (slow cycles) |
Operator-cleared cap chute jams, brief photo-eye trips, running the filler at 52 BPM instead of a 60 BPM ideal rate to control foaming or glass contact |
Quality (Q) |
Good Count ÷ Total Count, where Good Count = Total Count − Reject Count |
5. Process Defects (steady-state scrap/rework) 6. Reduced Yield (startup scrap/rework) |
Underfill/overfill rejects, cocked or missing caps, skewed labels requiring rework, startup purge bottles after changeover |
| Overall OEE | OEE = A × P × Q = Good Count ÷ (Planned Production Time × Ideal Run Rate) |
All six equipment losses combined | Ratio of Fully Productive Time (making only Good Bottles at Ideal Run Rate) to Planned Production Time |
Vorne notes that OEE Quality follows a First Pass Yield definition: Good Count includes only containers that pass through the process the first time without needing rework. On a bottling line, a bottle diverted for hand relabeling or decapping/re-capping is counted in Reject Count for OEE purposes even if the glass or liquid is later recovered. How inspection stations detect and divert faulty containers is covered in bottle inspection systems.
2. Two equivalent calculation paths—and how double-counting happens
Because OEE = Availability × Performance × Quality reduces algebraically to Good Count ÷ (Planned Production Time × Ideal Run Rate), you can calculate shift good bottles using either Path A (explicit factors from Run Time) or Path B (aggregate OEE from Planned Production Time):
- Path A (Explicit Factor Method):
Good Bottles per Shift = Run Time (min) × Ideal Run Rate (BPM) × Performance (P) × Quality (Q)(HereRun Timealready hasStop Timesubtracted, so you multiply only byPandQ, not byAor fullOEE.) - Path B (Aggregate OEE Method):
Good Bottles per Shift = Planned Production Time (min) × Ideal Run Rate (BPM) × OEE(HereOEE = A × P × Qalready containsAvailability, so you multiply by fullPlanned Production Time, not byRun Time.)
Swipe or scroll horizontally to see all columns.
| Common calculation mistake | What gets deducted twice | Correct treatment |
|---|---|---|
Subtracting changeover and breakdown minutes to get Run Time, and multiplying Run Time × Ideal Run Rate × OEE |
Availability (A) is deducted once in Run Time and a second time inside OEE |
Either use Planned Production Time × Ideal Run Rate × OEE (Path B) or use Run Time × Ideal Run Rate × P × Q (Path A) |
Entering a derated running speed (for example, 50 BPM instead of a 60 BPM ideal rate) and multiplying by a Performance factor P that already reflects running at 50/60 speed |
Reduced Speed (P) is deducted in both the rate input and the efficiency multiplier |
Keep Ideal Run Rate fixed at the defined baseline rate (60 BPM) and put the speed reduction in P (50 ÷ 60 = 83.33%), or set P to cover minor stops only and document the basis |
Subtracting rejected bottles from the output of Planned Production Time × Ideal Run Rate × OEE |
Quality (Q) is deducted once inside OEE and a second time by subtracting Reject Count afterward |
Planned Production Time × Ideal Run Rate × OEE already yields Good Count |
Takeaway: Before multiplying a quoted BPM by an efficiency percentage, check whether that percentage is Availability × Performance × Quality (apply to Planned Production Time) or Performance × Quality during active running (apply to Run Time).
Worked examples: forward shift output and reverse speed sizing (assumed inputs)
The two worked examples below use assumed inputs to show how the worksheet equations behave. They are arithmetic demonstrations—not measured plant data, industry averages or performance guarantees for any glass bottle or machine.
Worked Example 1: Forward calculation from a quoted pacing rate to shift good bottles (assumed inputs)
Suppose a plant team is evaluating a proposal where the pacing station has a stated Ideal Run Rate of 60 BPM (3,600 BPH, or 1.0 second per bottle Ideal Cycle Time) on their 330 ml glass bottle drawing. They want to calculate expected good bottles for one 8-hour shift (480 minutes) under the following assumed shift inputs:
- Schedule Loss (breaks and meal period):
60 minutes(two 15-minute breaks and one 30-minute meal period where production is not scheduled to run). - Planned Stops and Unplanned Stops (
Stop Time):45 minutestotal (30 minutesfor one bottle/label changeover and15 minutesof unplanned conveyor/capper stops). See bottling-line changeovers for what drives changeover duration. - Assumed Performance factor (
P):90.0%(0.90, accounting for brief operator-cleared minor stops and running slightly below 60 BPM). - Assumed Quality factor (
Q):98.0%(0.98, representing First Pass Yield after startup purge and fill-level/cap/label inspection rejects). - Pack format:
12 bottles per case.
Swipe or scroll horizontally to see all columns.
| Step | Calculation using Vorne equations | Result (Assumed example) |
|---|---|---|
| 1. Planned Production Time | 480 min Shift Length − 60 min Breaks |
420 min (7.0 hours) |
| 2. Run Time | 420 min Planned Production Time − 45 min Stop Time |
375 min (6.25 hours) |
3. Availability (A) |
375 min Run Time ÷ 420 min Planned Production Time |
0.8929 (89.29%) |
| 4. Theoretical bottles in Planned Time | 420 min × 60 BPM |
25,200 bottles |
| 5. Total Count produced during Run Time | 375 min Run Time × 60 BPM × 0.90 Performance |
20,250 total bottles |
| 6. Reject Count | 20,250 Total Count × (1 − 0.98 Quality) |
405 rejected/rework bottles |
| 7. Good Count (Path A: Explicit factors) | 375 min × 60 BPM × 0.90 × 0.98 (20,250 − 405) |
19,845 good bottles / shift |
8. Overall OEE (A × P × Q) |
0.892857 × 0.90 × 0.98, or (19,845 × 1.0 s) ÷ (420 × 60 s) |
0.7875 (78.75%) |
| 9. Good Count (Path B: Aggregate OEE) | 420 min Planned Production Time × 60 BPM × 0.7875 OEE |
19,845 good bottles / shift |
| 10. Packed good cases (12-pack) | 19,845 good bottles ÷ 12 bottles/case |
1,653 full cases (+ 9 bottles) |
Notice the difference between three numbers that often get confused in project meetings:
- Naive clock-hour multiplication (
480 min × 60 BPM):28,800 bottles(ignores breaks, changeovers, minor stops and rejects). - Actual shift Good Count (
Path AorPath B):19,845 good bottles(1,653twelve-bottle cases). - Double-counted error (
375 min Run Time × 60 BPM × 0.7875 OEE):17,719 bottles(wrongly deducts the 45-minute changeover/breakdown stop time twice—once to reduce420 minto375 min, and again inside the78.75%OEE factor).
Worked Example 2: Reverse calculation from a daily good-bottle target to required line speed (assumed inputs)
When sizing a new line from a daily demand target, start with required Good Count and work backward to the minimum Ideal Run Rate the pacing station must achieve on your container:
- Formula (using aggregate OEE):
Required Ideal Run Rate (BPM) = Target Good Bottles ÷ (Planned Production Time in min × OEE) - Formula (using explicit factors):
Required Ideal Run Rate (BPM) = Target Good Bottles ÷ (Run Time in min × Performance × Quality)
In its BPM sizing article, LPS notes that producing 16,000 bottles over an 8-hour window requires 2,000 BPH or 33.3 BPM (16,000 ÷ 8 ÷ 60) before accounting for stops or other equipment. The table below shows how adding explicit shift time and loss assumptions changes the required pacing-station speed for an assumed target of 16,000 good bottles per shift:
Swipe or scroll horizontally to see all columns.
| Sizing scenario (Assumed inputs) | Planned Production Time | Stop Time / Run Time | Assumed P and Q (or OEE) |
Required Ideal Run Rate (BPM) | Equivalent Required Rate (BPH) |
|---|---|---|---|---|---|
| Unadjusted clock-time division (LPS baseline arithmetic before losses) | 480 min (no break deduction) | 0 min stops / 480 min run | P = 100%, Q = 100% (OEE = 100%) |
33.3 BPM (16,000 ÷ 480) |
2,000 BPH |
| Single-SKU shift with breaks and moderate losses | 420 min (480 min − 60 min breaks) | 35 min stops / 385 min run (A = 91.67%) |
P = 90%, Q = 98.5% (OEE = 81.26%) |
46.9 BPM (16,000 ÷ (385 × 0.90 × 0.985)) |
2,813 BPH |
| Multi-SKU shift with two format changeovers | 420 min (480 min − 60 min breaks) | 75 min stops / 345 min run (A = 82.14%) |
P = 88%, Q = 97.5% (OEE = 70.48%) |
54.0 BPM (16,000 ÷ (345 × 0.88 × 0.975)) |
3,243 BPH |
In this assumed example, two changeovers and realistic running/reject allowances raise the required pacing-station nameplate speed from 33.3 BPM (2,000 BPH) to 54.0 BPM (3,243 BPH) for the same 16,000 good bottles per shift.
Copyable filling-line output and OEE input worksheet
Copy the table below into your project file or download the blank CSV worksheet to evaluate two candidate line proposals side by side. Leave any cell blank (Pending) until the supplier confirms the figure for your exact glass bottle drawing, closure and liquid, or clearly label your own planning estimate as Assumed.
Swipe or scroll horizontally to see all columns.
| Field | Unit | Formula or definition | Candidate A | Candidate B | Verification note |
|---|---|---|---|---|---|
| Bottle drawing, neck finish and fill volume | ml or fl oz | Fixed container drawing and fill point | ______ | ______ | See bottle specification checklist |
| Product, fill temperature, viscosity and carbonation | cP / °C / bar | Liquid condition stated for the speed rating | ______ | ______ | Confirm same liquid across all stations |
| Pacing station and included stations | station list | Slowest linked station governing line rate | ______ | ______ | See planning a glass bottling line |
Stated Ideal Run Rate (BPM) |
bottles/min | Instantaneous rate on your bottle (for indexing filler: Heads × Cycles/min) |
______ | ______ | Must state bottle size and product basis |
Equivalent hourly rate (BPH) |
bottles/hr | 60 × BPM |
______ | ______ | Unit conversion only |
| Ideal Cycle Time | s/bottle | 60 ÷ BPM |
______ | ______ | Reciprocal of Ideal Run Rate |
| Shift Length (All shift time) | minutes | Scheduled clock length of the shift | ______ | ______ | Plant schedule input |
| Schedule Loss (Breaks / meal / no-order time) | minutes | Excluded before OEE begins | ______ | ______ | Do not include changeovers here |
| Planned Production Time | minutes | Shift Length − Schedule Loss |
______ | ______ | OEE time denominator |
| Planned + Unplanned Stop Time | minutes | Changeovers, cleaning, breakdowns, starving/blocking | ______ | ______ | Availability loss minutes |
| Run Time | minutes | Planned Production Time − Stop Time |
______ | ______ | Active running time |
Availability (A) |
decimal (0–1) | Run Time ÷ Planned Production Time |
______ | ______ | First OEE factor |
Performance (P) |
decimal (0–1) | (Total Count ÷ Run Time) ÷ Ideal Run Rate |
______ | ______ | Minor stops + reduced speed |
Expected or observed Total Count |
bottles | Run Time × Ideal Run Rate (BPM) × P |
______ | ______ | Total containers cycled |
Expected or observed Reject Count |
bottles | Startup reduced yield + steady-state rejects/rework | ______ | ______ | First Pass Yield deduction |
Quality (Q) |
decimal (0–1) | (Total Count − Reject Count) ÷ Total Count |
______ | ______ | Third OEE factor |
| Overall OEE | decimal (0–1) | A × P × Q |
______ | ______ | Do not treat as a machine speed warranty |
| Expected Good Bottles / Shift (Path A) | good bottles | Run Time × Ideal Run Rate (BPM) × P × Q |
______ | ______ | Matches Path B |
| Expected Good Bottles / Shift (Path B) | good bottles | Planned Production Time × Ideal Run Rate (BPM) × OEE |
______ | ______ | Do not also subtract Stop Time |
| Bottles per case | bottles/case | Case pack pattern | ______ | ______ | See case packing and palletizing |
| Expected Good Cases / Shift | good cases | Expected Good Bottles ÷ Bottles per case |
______ | ______ | Usable packed output |
Questions and document checks for supplier proposals
When comparing written machine or line proposals, use these questions to confirm that every supplier’s speed and acceptance test rest on the same definitions:
- Container and liquid basis of the rated speed. Was the stated BPM or BPH established on our exact glass bottle drawing, neck finish, fill volume, product viscosity, fill temperature and carbonation/foaming state, or is it a catalog maximum on water in a smaller container?
- Filler cycle breakdown. For an intermittent or inline indexing filler, how many fill heads are included, and how many seconds are allotted to bottle indexing, nozzle dive/retract, liquid dispensing and settle/drip delay in each cycle?
- Line pacing and upstream/downstream margin. Which machine is designed as the pacing station, what instantaneous BPM/BPH is stated for the depalletizer, rinser, capper, labeler, inspector and case packer on either side of it, and what accumulation time is provided between them?
- Changeover and cleaning time definition. What documented changeover and cleaning durations apply when switching between our bottle formats or products, and what staffing is assumed? (Use those minutes in
Stop TimeinsideAvailability.) - Factory Acceptance Test (FAT) and Site Acceptance Test (SAT) counting rules. During acceptance testing, what run duration, container count, allowed stop reasons, target speed (
Ideal Run Rate) and maximum reject rate (Quality) define a passing run? Does an efficiency target in the contract include or exclude format changeovers, material starvation and operator breaks?
To organize the rest of the commercial and technical package—including utilities, change parts, guarding, controls and acceptance documentation—use the bottling equipment RFQ checklist and the Bottling Lines section overview.
Method, sources and limitations
This guide combines unit-conversion arithmetic with published explanations of filling-machine speed factors from Liquid Packaging Solutions (LPS) and standard Overall Equipment Effectiveness (OEE) definitions from Vorne Industries (OEE.com). SG Containers Review is an independent editorial reference and does not manufacture, sell or test bottling machinery.
- What this page does not cover: It does not publish cross-manufacturer speed benchmarks, promise achievable plant output or OEE scores, extrapolate pharmaceutical vial, pail or pouch speeds to glass beverage or food bottles, or replace a line simulation or supplier Factory Acceptance Test.
- Assumed examples vs. published facts: The 4-head (24 BPM), 8-head (32 BPM), 16,000-bottle/day (33.3 BPM) and 16-head filler / 60 BPM labeler illustrations are cited directly from LPS’s published articles. The time buckets (
Planned Production Time,Run Time), loss categories (Six Big Losses) and OEE equations (A × P × Q) are cited from Vorne Industries. The two shift worksheets (19,845 good bottles/shiftand the16,000 good bottles/shiftreverse-sizing table) use explicitly assumed inputs to demonstrate the formulas.
Primary sources cited
- Filling Machine Speed - Bottles Per Minute and Bottle Size, Liquid Packaging Solutions (LPS): why BPM depends on automation level, product viscosity/foaming and bottle size, plus the 4-head × 6 cycles/min = 24 BPM illustration on 16 oz bottles. Accessed October 17, 2026.
- Filling Machines: Figuring Out Your Bottles Per Minute Need, Liquid Packaging Solutions (LPS):
BPM = Fill Heads × Cycles per Minute, cycle-time breakdown (6 s indexing + 3 s dive + 6 s fill = 15 s cycle → 32 BPM on 8 heads), and baseline 16,000 bottles/day ÷ 8 hours = 2,000 BPH (33.3 BPM) arithmetic. Accessed October 17, 2026. - The Overall Speed of a Packaging Line, Liquid Packaging Solutions (LPS): why the slowest linked station governs overall line throughput (80–100 BPM filler and 100 BPM capper limited to 60 BPM by the labeler). Accessed October 17, 2026.
- OEE Calculation: Definitions, Formulas, and Examples, Vorne Industries (OEE.com): formulas for Planned Production Time, Run Time, Good Count, Availability, Performance, Quality, Ideal Cycle Time / Ideal Run Rate, and equivalence of
A × P × Qwith(Good Count × Ideal Cycle Time) ÷ Planned Production Time. Accessed October 17, 2026. - OEE Factors: Availability, Performance, and Quality and Six Big Losses in Manufacturing, Vorne Industries (OEE.com): exclusion of Schedule Loss before Planned Production Time, and mapping of Equipment Failure, Setup and Adjustments, Idling and Minor Stops, Reduced Speed, Process Defects and Reduced Yield to Availability, Performance and Quality. Accessed October 17, 2026.
Related guides
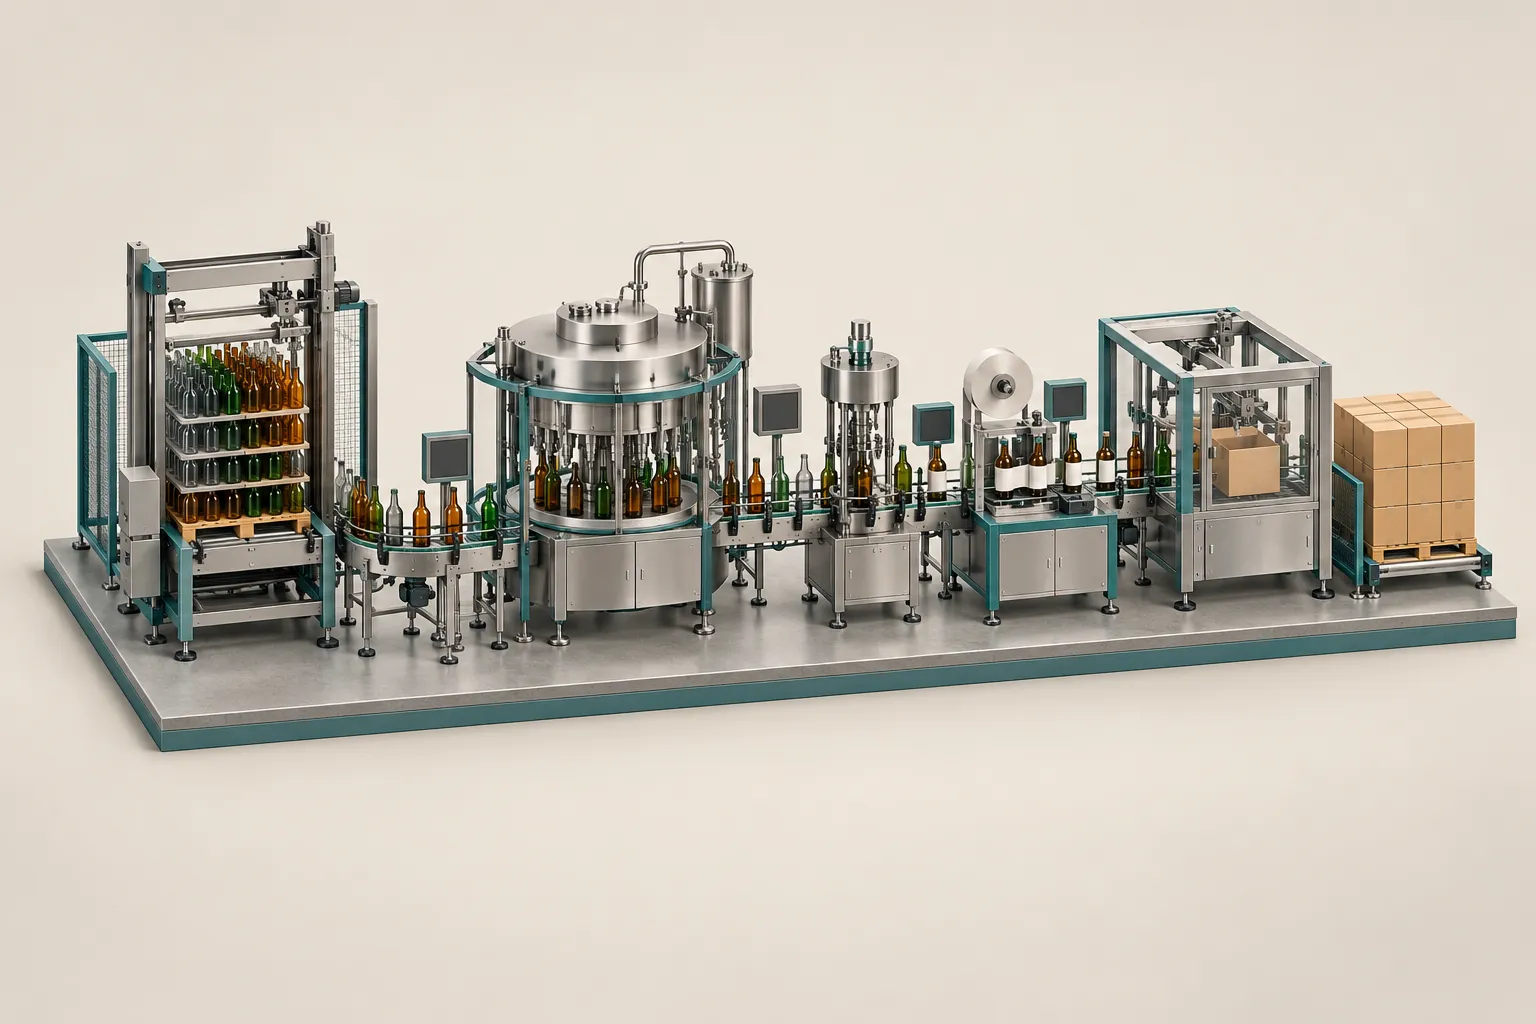
Planning a Glass Bottling Line: From Empty Bottles to Packed Cases
How to divide a glass bottling line into stations, size buffers around the bottleneck machine, and confirm machine interfaces before requesting quotes.
Read the guide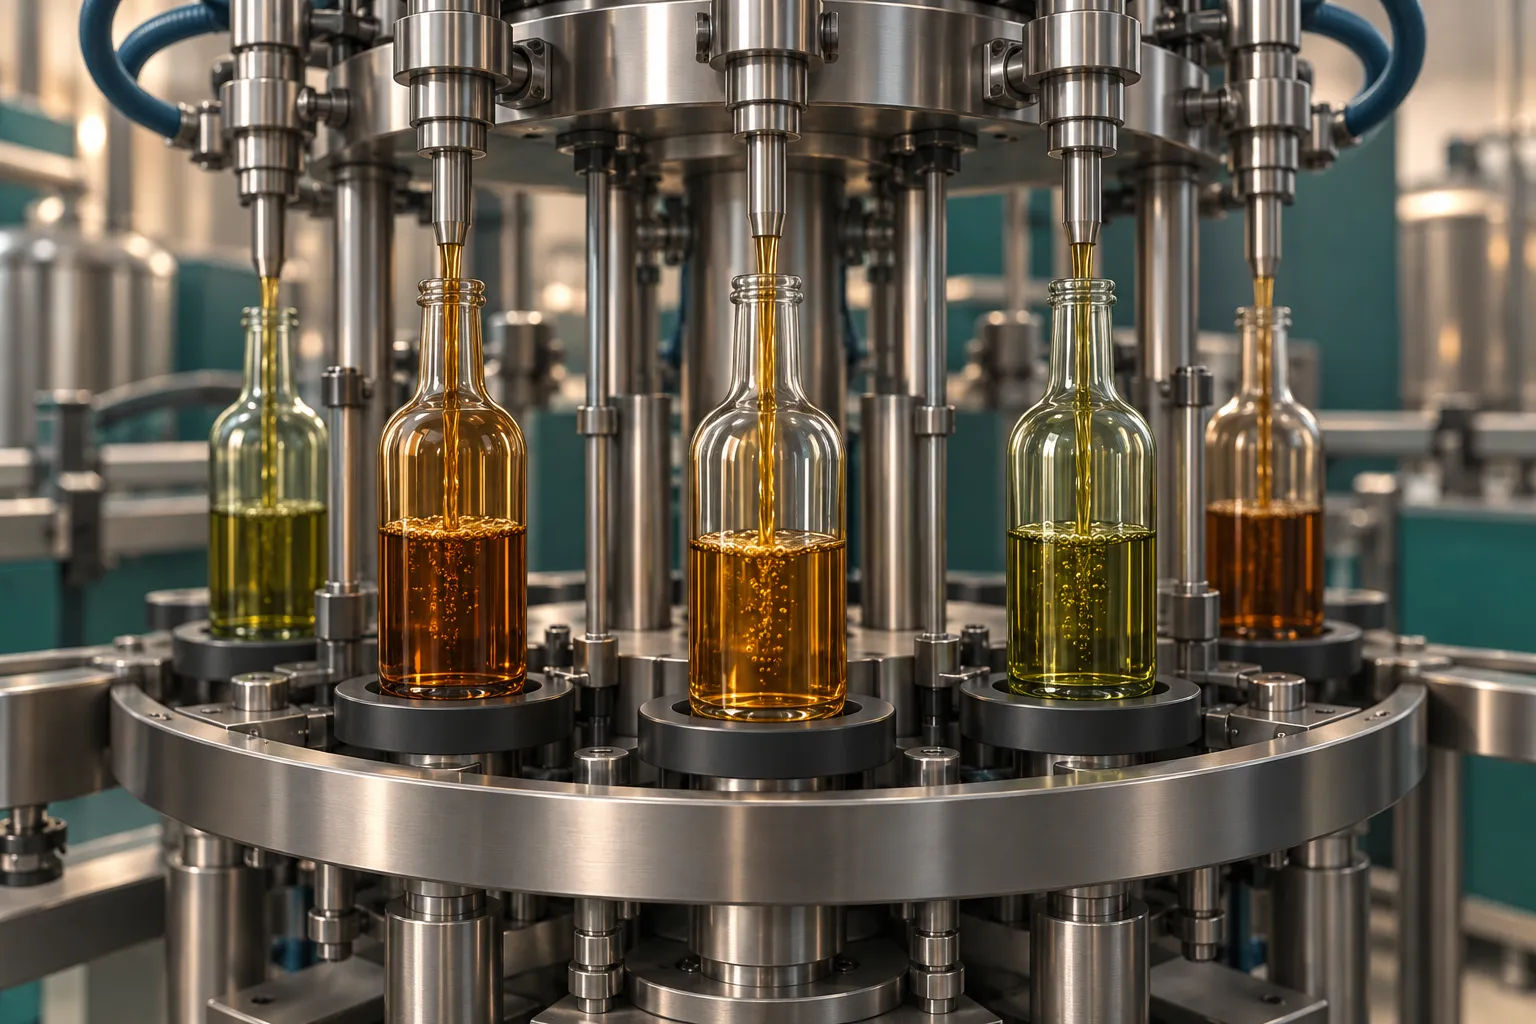
Glass Bottle Filling Machines: How to Compare Filling Principles
Compare gravity, vacuum, counter-pressure, piston and flowmeter filling for glass bottles by product, container and line fit, and learn what to ask suppliers.
Read the guide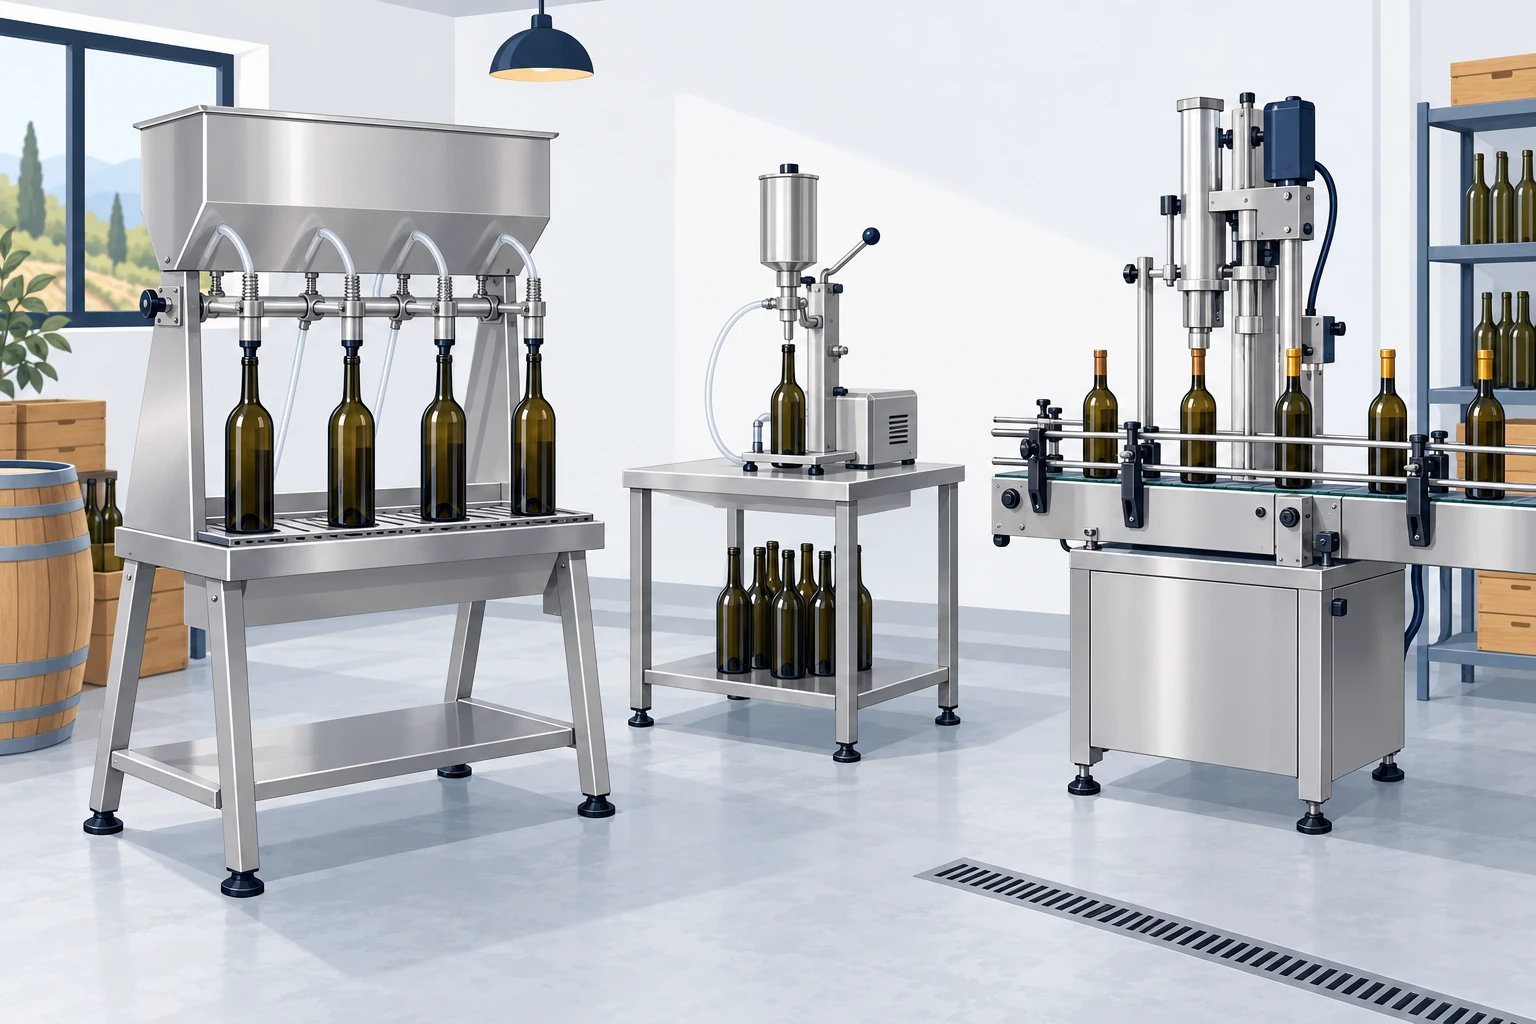
Small-Scale Bottling Equipment: Manual, Semi-Automatic or a Compact Line?
How small glass-bottle producers can choose between manual fillers, semi-automatic machines and compact lines, using published rates and bottle-fit limits.
Read the guide